

At work, one of the more interesting customizations we have on WordPress.com for our VIP clients is a dashboard that contains custom widgets. One of them is a page generation graph that shows the average page generation time for their site compared to all others. That way they can judge their code performance against a good baseline.
I was curious if I could create something similar for my sites. I know that I couldn’t get a reference of millions of other sites like on WordPress.com, but I thought it would be cool just to see how the site performs over time. So I did:
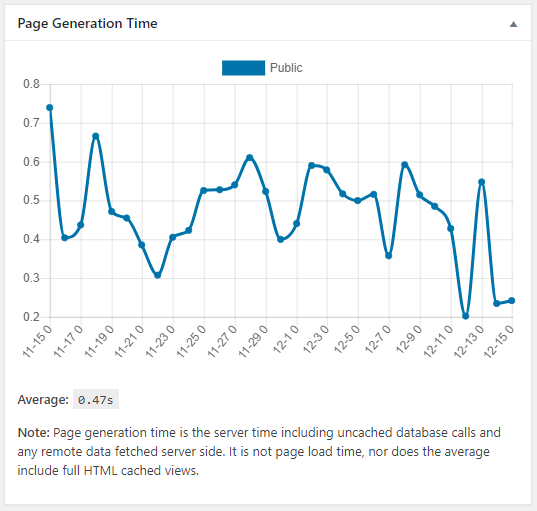
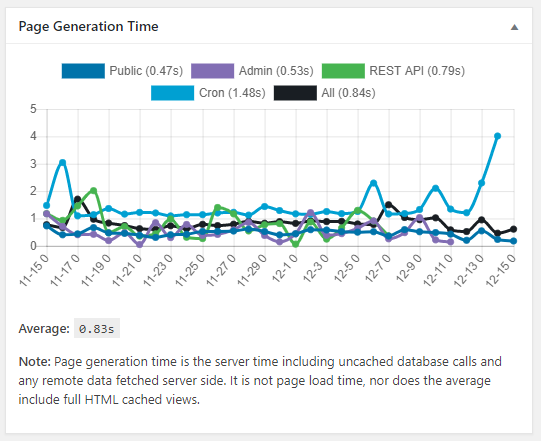
I did go ahead added some options to compare different types of pages:

It gets a little crazy though with everything:
The data records the exact URL that is being accessed and the time it takes, so if you want you can dig into the database and see what pages are taking the longest to try and fix any performance issues. If you’re interested, the code is on GitHub:

Leave a Reply